Building Secure Cloud Pipelines: Terraform, Kubernetes, Vault, and CI/CD Automation Mastery
project repo; https://github.com/mafike/dev-sec-proj.git
Hello, and thanks for joining me here! As someone deeply passionate about DevOps, I’ve immersed myself in the challenges and intricacies of designing, implementing, and managing CI/CD pipelines for real-world projects. While diving into every single tool in the DevOps stack can feel overwhelming, I’ve prioritized what matters most to me: security, application resiliency, and addressing the pitfalls of a complete stack process. These are areas I obsess over because I believe they form the foundation of robust and scalable systems.
To be honest, this project didn’t start as what you’ll see today. Initially, I just wanted to create a small GitHub tutorial project to showcase for job applications. But as I started working on it, my real-world experience and work ideas began to seep into it. Suddenly, what was supposed to be a simple exercise turned into something I approached like a real production-grade system. The deeper I dove, the more I realized that I didn’t want to cut corners or hold back. So, I decided to embrace the challenge and treat this project as seriously as I would for any client or team.
Of course, you might notice some flaws or think certain things could have been done differently—and you’re absolutely right. It’s natural to have differing perspectives, and this project reflects my personal approach, opinions, and the solutions I’ve chosen to implement. My aim here is not to present the “perfect” system but to share my journey, my thought process, and how I’ve applied my knowledge to build something meaningful.
My journey in DevOps may be a few years deep, but it’s been a relentless pursuit of mastery. I’ve had the opportunity to work with and learn from different teams and projects, gaining hands-on experience with tools like Jenkins, Terraform, Kubernetes, Vault, and Istio, to name a few. Each of these tools plays a crucial role in achieving my vision of secure, resilient, and production-ready systems.
This blog is both a reflection of my journey and a showcase of what I’ve built so far. It’s an evolving project that blends lessons from client engagements, industry experience, and my personal drive to innovate. From creating scalable Kubernetes clusters to setting up secret management with Vault, using Istio for secure service communication, and integrating monitoring and logging systems like Prometheus, Grafana, and Elastic Stack, every step has involved real-world challenges and solutions.
What sets this project apart is its deeply personal nature—it’s not just a technical demonstration but a narrative of how my experiences, priorities, and passion for solving tough problems shape my approach. Whether it was helping clients migrate workloads to Kubernetes, implementing CI/CD workflows with Jenkins, or tackling complex security issues, I strove to integrate practical, job-tested strategies into everything I built.
In this blog, I’ll share the story of my progress so far, the tools I’ve prioritized, and the decisions I’ve made along the way. I’ll also explore what’s next—such as enhancing security with advanced scanning tools, fine-tuning disaster recovery strategies, and refining monitoring and observability for production-grade environments. This project grows with me as I continue to improve and push boundaries in my work as a DevOps engineer.
My hope is that this journey not only highlights my capabilities but also inspires others to embrace challenges, think critically about security and resiliency, and build their own DevOps solutions with confidence.
A Snapshot of My Pipeline Journey
When I first started this project, I had no idea it would grow into something so detailed and close to a production-grade setup. What began as a small GitHub tutorial quickly transformed into something much bigger—almost leaning into the realm of DevSecOps. I can’t say for sure that I’m fully qualified to claim that title just yet, but it’s definitely my dream. I know I still have a long way to go, but this project has been a step in the right direction.
What started as a simple exercise evolved into this intricate CI/CD pipeline, where every stage reflects the challenges I’ve faced and the solutions I’ve implemented in real-world scenarios. It’s a blend of what I’ve learned so far and what I continue to improve upon daily.
The image below captures the flow of the pipeline as it stands today. From building and testing the code to scanning for vulnerabilities, deploying to Kubernetes, and running integration tests, this journey has been as much about learning as it has been about implementing. Each step represents a story—whether it’s figuring out how to integrate security scans seamlessly or ensuring deployments meet best practices.
This project leverages a comprehensive suite of tools and platforms to demonstrate modern DevOps practices, emphasizing security, automation, scalability, and observability. Below is a detailed list of the tools and technologies I’ve used or assumed as prerequisites:
Version Control and Collaboration
Git/GitHub: Central to this project for version control and source code management. Every change in the pipeline or application code is tracked, allowing easy collaboration and rollback when needed. While GitHub Actions are commonly used for workflow automation, this project integrates GitHub with Jenkins for CI/CD processes.
Slack: Configured to receive real-time notifications from the CI/CD pipeline, such as build statuses, deployment results, and security scan alerts. These notifications use custom attachments to provide detailed build results and human-readable interactions, making it easier for the team to understand issues at a glance. Additionally, Slack has been integrated with Falco and Alertmanager, allowing it to serve as a centralized notification hub for monitoring Kubernetes clusters and alerting on runtime security events or system anomalies.
Cloud Infrastructure and Orchestration
When it came to building the foundation for this project, I knew I needed an architecture that would support scalability, security, and high availability—principles I’ve always prioritized in my work. What started as a basic plan quickly evolved into the architecture you see here, a system designed to simulate a real-world production environment as closely as possible.
This diagram captures the core components of my infrastructure:
AWS as the Cloud Backbone:
AWS provides the infrastructure hosting this entire setup. Key services like Elastic Kubernetes Service (EKS) for container orchestration, Route 53 for DNS management, and Elastic Load Balancers (ALB) for distributing traffic are central to this design. Additionally, AWS powers a highly available Jenkins cluster integrated with Elastic File System (EFS) for persistent storage, Auto Scaling Groups (ASG) for high availability, and Amazon Certificate Manager (ACM) for automated certificate management to enable secure communication. The inclusion of NAT Gateways and private subnets ensures secure, isolated networking.Terraform for Infrastructure as Code (IaC):
The entire architecture is provisioned and managed using Terraform. Its modular approach ensures repeatability and consistency, allowing the creation and management of resources such as Kubernetes clusters, Jenkins servers, Nexus repositories, IAM roles, networking components, and storage. Terraform workflows validate, plan, and safely apply infrastructure changes, making the process efficient and predictable.Kubernetes for Orchestration:
Kubernetes acts as the primary orchestrator for managing and scaling containers across the cluster. All workloads, ranging from simple applications to monitoring systems, run in Kubernetes. The cluster also hosts critical services such as SonarQube for code quality analysis and Nexus for artifact management. Integrated with Istio as the service mesh, Kubernetes enables secure communication, traffic management, and enhanced observability.Nexus Repository:
Hosted in a private subnet, Nexus serves as a centralized repository for managing build artifacts, including Docker images and dependencies. This ensures a seamless flow between the build and deployment stages in the CI/CD pipeline.Jenkins Cluster for CI/CD:
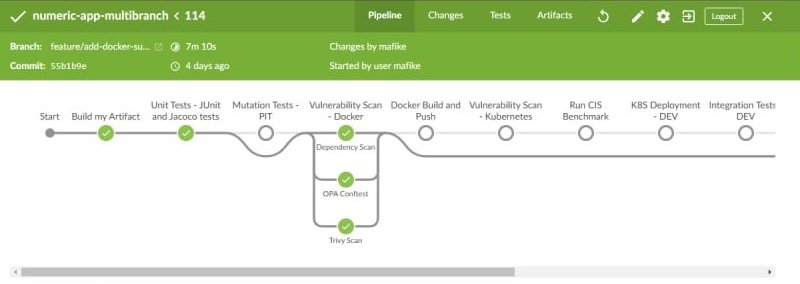
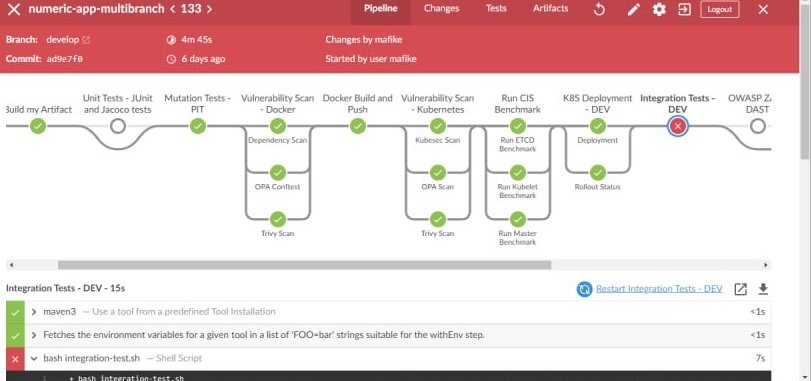
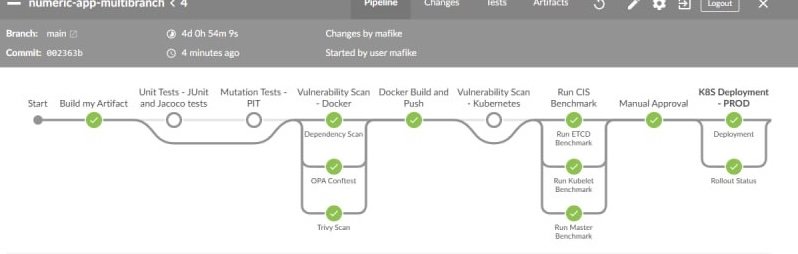
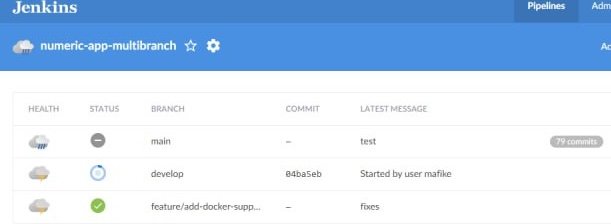
The Jenkins cluster, deployed in private subnets, leverages an ALB for secure routing and an ASG for high availability. Persistent storage is provided by EFS to ensure builds and configurations are retained across instances. Jenkins automates the CI/CD workflows, orchestrating tasks like building applications, running tests, and deploying to Kubernetes. The pipeline is dynamic, utilizing Kubernetes agents for scaling tasks as needed.Secure Networking and Monitoring:
Networking is designed with strict security controls, including bastion hosts for controlled access to the private subnets. Monitoring is handled via tools integrated into the Kubernetes ecosystem, such as Prometheus for metrics and ELK Stack for centralized logging. Falco provides runtime security for Kubernetes, detecting and alerting on suspicious activities.

Containerization and Dependency Management
- Docker: Handles the packaging of applications into lightweight containers, ensuring consistency across development, testing, and production environments.
- Nexus Repository: Acts as a centralized location to store build artifacts, such as Docker images and libraries, ensuring smooth dependency management across environments.
CI/CD and Automation
Jenkins: The backbone of the CI/CD pipeline, orchestrating the entire process from building the application, running tests, performing security scans, and deploying to Kubernetes clusters. The pipeline is written using Groovy scripts, which provide flexibility and scalability. To optimize resource usage, Jenkins dynamically provisions additional agents from the Kubernetes cluster, ensuring that builds and tasks scale seamlessly based on demand.
Python and Bash Scripting: These scripting languages are integral to automating custom tasks that go beyond Jenkins’ native capabilities. Python and Bash are used for managing Kubernetes deployments, triggering scans and integration tests, creating custom result data for reporting, and automating repetitive workflows. These scripts ensure smooth integration between various tools and processes within the pipeline.
Security and Compliance
Vault: Centralized secrets management system ensuring that sensitive data such as database credentials and AWS credentials are securely stored and accessed only when needed. Vault integration eliminates the need to hardcode secrets into applications or configuration files. Additionally, Vault is integrated with Kubernetes Secret Manager to enable automatic TLS certificate issuance, enhancing security and simplifying certificate management.
OWASP (DAST and SAST): A combination of Static Application Security Testing (SAST) and Dynamic Application Security Testing (DAST) tools are used to identify vulnerabilities in the codebase and during runtime. These scans help proactively detect and mitigate risks before they reach production, ensuring a secure software development lifecycle.
OPA (Open Policy Agent): Enforces security and compliance policies for both Docker and Kubernetes environments. OPA ensures that configurations and deployments adhere to best practices, such as resource limits and role-based access control (RBAC).
KubeScan: Conducts vulnerability assessments of Kubernetes clusters, providing detailed insights into potential security gaps in cluster configurations. It serves as a critical tool for hardening Kubernetes security.
Falco: A runtime security tool that monitors activities in Kubernetes clusters. It detects suspicious behaviors, such as container escapes, privilege escalations, or unauthorized access, and generates real-time alerts for potential threats.
KubeSec: Analyzes Kubernetes manifests to identify security misconfigurations, such as overly permissive roles, missing resource limits, or insecure settings. It provides actionable recommendations to enhance manifest security.
Trivy: A versatile vulnerability scanner used for container images, file systems, and Git repositories. Trivy is integrated into the CI/CD pipeline to detect security vulnerabilities in Docker images and Kubernetes resources before deployment, ensuring that only secure artifacts are moved into production.
CIS Benchmarks: Validates Kubernetes clusters and node configurations against the Center for Internet Security (CIS) benchmarks, ensuring adherence to industry-recognized security standards and reducing risks from misconfigurations.
Inside the Kubernetes Cluster: Integrations and Solutions
When I started building the internal structure of my Kubernetes cluster, I wanted it to solve real-world problems while reflecting the complexities of a production-grade environment. My goal was to prioritize security, scalability, and observability—three pillars that drive the success of any cloud-native system. Each integration in this cluster serves a purpose, solving challenges I’ve encountered in my learning journey and work experience.
1. Secrets Management and Dynamic Credentials
One of the first challenges I tackled was managing sensitive data securely. Hardcoding credentials was out of the question, so I turned to Vault:
- Dynamic MySQL Credentials: Vault is integrated with MySQL to generate temporary credentials on-demand, ensuring each service uses credentials that are short-lived and unique. This reduces exposure and enhances security across the stack.
- Secret Injection for Applications: Vault is also used to inject secrets directly into the runtime environment of applications, keeping sensitive data out of static files and configurations.
- TLS Certificate Issuance: By integrating Vault with Cert-Manager, the cluster dynamically issues TLS certificates, ensuring secure communication without manual certificate management.
3. Centralized Logging and Observability
Visibility into the cluster is critical for debugging and understanding application behavior:
- EFK Stack (Elasticsearch, Fluentd, Kibana): Logs from all services are aggregated into Elasticsearch, with Fluentd collecting logs and routing them for indexing. Kibana provides a user-friendly interface for searching and visualizing these logs, making troubleshooting significantly easier.
- Kiali and Jaeger: Kiali offers a real-time visualization of the Istio service mesh, helping me monitor traffic flow and detect issues quickly. Jaeger complements this by providing distributed tracing, allowing me to track requests across microservices and identify bottlenecks.
4. Real-Time Monitoring and Alerting
To ensure the system remains reliable and secure, I integrated a comprehensive monitoring stack:
- Prometheus and Grafana: Prometheus collects detailed metrics across the cluster, which are visualized in Grafana’s dynamic dashboards. These tools provide insights into resource usage, performance, and cluster health.
- Falco for Runtime Security: Falco continuously monitors the cluster for suspicious runtime behaviors, such as unexpected privilege escalation or unauthorized file access. Alerts are sent directly to a Slack channel, ensuring rapid response to potential threats.
- Alertmanager: Integrated with Prometheus, Alertmanager routes critical alerts to Slack and other channels, ensuring timely responses to issues like resource exhaustion or application failures.
5. Scalable and Resilient Application Deployment
The next step was ensuring applications could scale dynamically and remain resilient under varying workloads:
- Horizontal Pod Autoscaler (HPA): HPA ensures that application pods scale automatically based on real-time resource usage, balancing performance and cost.
- Istio Sidecars for Traffic Policies: Every application pod is equipped with an Istio sidecar proxy, which enforces traffic routing, load balancing, and security policies. This ensures consistent behavior across the cluster.
Tying It All Together
Every tool and integration in this Kubernetes cluster plays a specific role, but together they create a unified system built for security, scalability, and observability. Whether it’s securing secrets with Vault, managing traffic with Istio, or monitoring performance with Prometheus and Grafana, each component solves a challenge I’ve faced in my DevOps journey.
This structure wasn’t built overnight. Each integration came with its own set of lessons, whether it was figuring out how to connect Vault to Cert-Manager for automated TLS issuance or learning how to visualize service dependencies with Kiali. It’s not perfect—there’s always room for improvement—but it’s a system I’m proud to have designed and implemented.
What’s Next?
As this project continues to grow, I’m looking to refine areas like scaling strategies, advanced traffic policies, and more robust security configurations. This journey has been about learning, solving problems, and applying what I’ve learned to build something meaningful.